Monitoring & Alerting
Learn how to access Codesphere's built in resource monitoring and check the uptime of your applications.

All Codesphere workspaces come with basic resource monitoring out of the box. This way you can always check how much CPU and RAM your applications consume at any point. For workspaces connected to a custom domain we also provide uptime monitoring and custom alerts (coming soon).
Resource monitoring
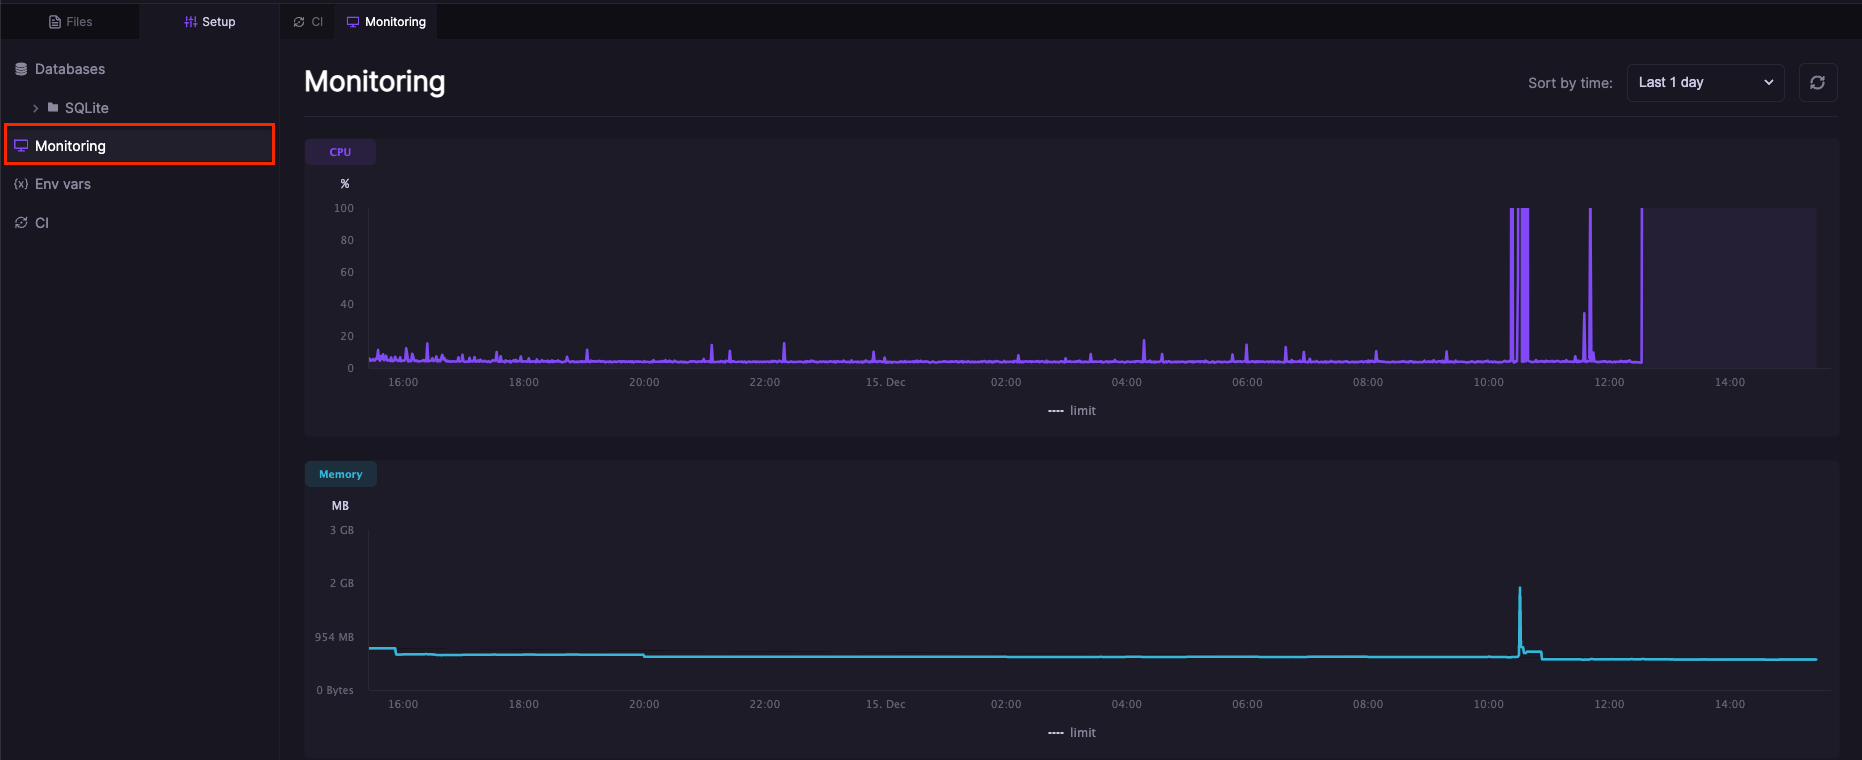
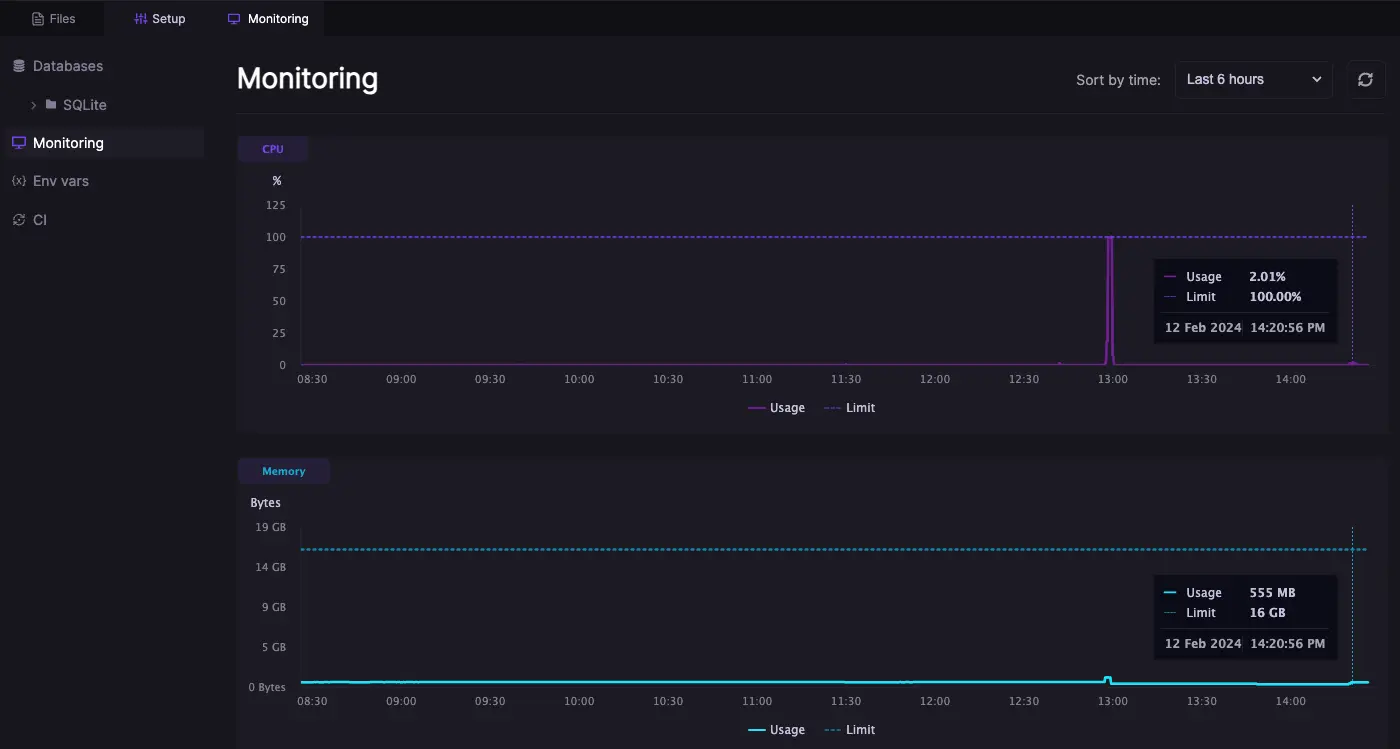
To open the resource monitoring, open any of your workspaces navigate to setup/monitoring and select the timeframe you want to review. Resource consumption data is saved for the last 14 days.
Uptime monitoring & alerts (coming soon)
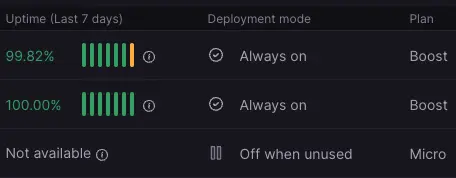
All always on workspaces connected to a custom domain will also display the uptime of that domain for the last 7 days. The way this works is there is a probe that is periodically checking your workspace's domain on port 3000 and saves the http response. It will show a green bar when all requests were successful (returned a code 200), yellow if some requests failed or red if most requests failed. Hovering over any bar will show the percentage of successful requests. It's important to note that historical data is tied to the domain, if you switch the workspace connected to a domain it will only start probing the new workspace at that point in time looking forward.
In the near future you will be able to configure health checks yourself, and retrieve call stacks and logs from specific times to investigate outages. Also you will be able to configure downtime alerts (email, and later web-hooks and SMS) to be notified when your app has issues.