Improving Code Quality using Embold
In the realm of software development, Embold helps developers maintain high code quality. It dives deep into your code to identify issues and provide suggestions on how to adress these issues.

Introduction
In the world of software development, code quality isn't just a buzzword – it's a necessity. The quality of code directly impacts the functionality, maintainability, and overall success of software projects. As projects grow and evolve, managing and ensuring code quality can become challenging. This is where tools like Embold come into play, offering a lifeline to developers and teams aiming for excellence.
What is Embold?
Embold is a software analytics platform designed to assist developers in crafting high-quality code. It scans code bases, identifies potential issues, and even suggests ways to enhance the code.
Key Features of Embold
- Code Analysis: At the heart of Embold lies its potent code analysis capability. With support for multiple programming languages, it meticulously scans for anti-patterns, bugs, and code smells, ensuring that developers are always aware of potential issues.
- Metrics: Metrics are the yardstick by which we measure code quality. Embold offers insights into various crucial metrics such as cyclomatic complexity, depth of inheritance, and coupling. These metrics give developers a clear picture of their codebase's health and areas that might require attention.
- Repository Insights: Beyond just code, Embold offers a bird's eye view of the entire project. Visual representations of the codebase structure, dependencies, and hotspots of change equip teams to make informed decisions.
- Integrations and CI/CD: In today's agile development environments, continuous integration and continuous delivery (CI/CD) are the norms. Embold seamlessly integrates into these pipelines, ensuring that code quality checks are an integral part of the development lifecycle.
- Recommendations: One of the standout features of Embold is its ability to not just identify problems, but also suggest solutions. With its actionable recommendations, developers have a clear path towards improving their code.
Getting Started with Embold
As a part of the BrowserStack suite, starting with Embold requires a BrowserStack account. You can create your account directly from embold.io.
Creating Your Account:
- Navigate to embold.io to begin the registration process.
- Since it's under the BrowserStack umbrella, you might find options to explore other BrowserStack services. However, if your primary interest is in Embold, follow the registration prompts specific to it.
Linking Your Git Provider:
- Once logged in, you'll be prompted to connect your preferred git provider. Embold supports a range of popular providers, ensuring a seamless integration process.
- By linking your git provider, you're allowing Embold to access your repositories for scanning. Rest assured, Embold maintains strict security protocols, ensuring your code's privacy and safety.
Selecting Repositories for Analysis:
- After connecting your preferred git provider, you'll be presented with a list of your repositories. Here, you can select which ones you'd like Embold to analyze.
- Upon selection, Embold initiates its scanning process, diving deep into your code to identify potential issues, anti-patterns, and areas of improvement.
Navigating Embold's Dashboard
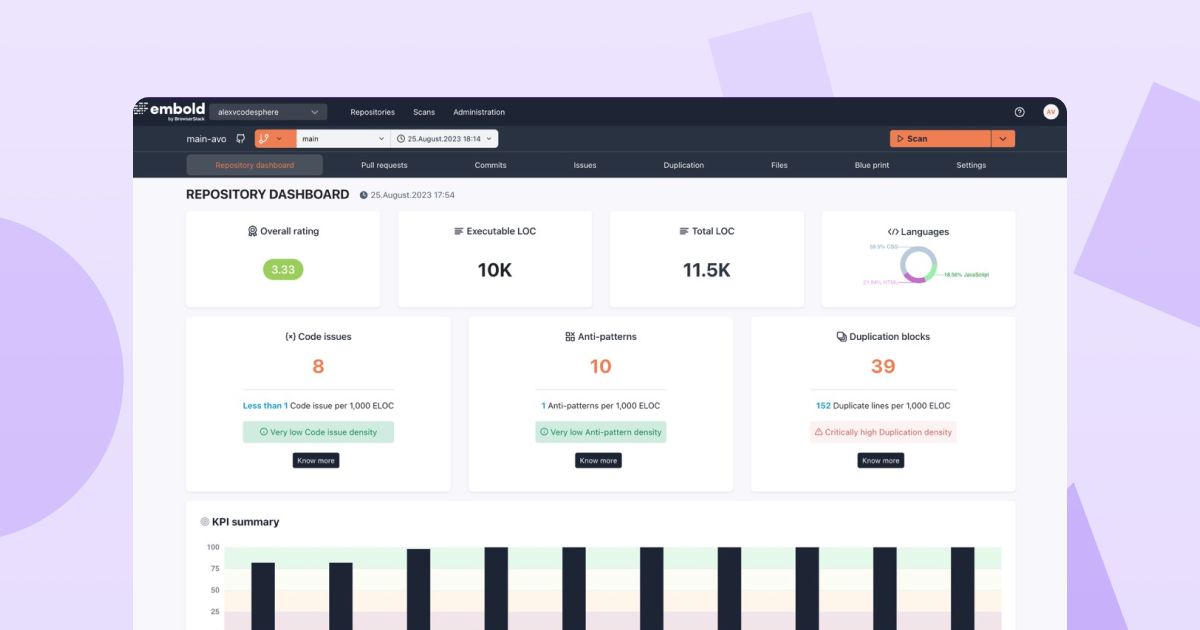
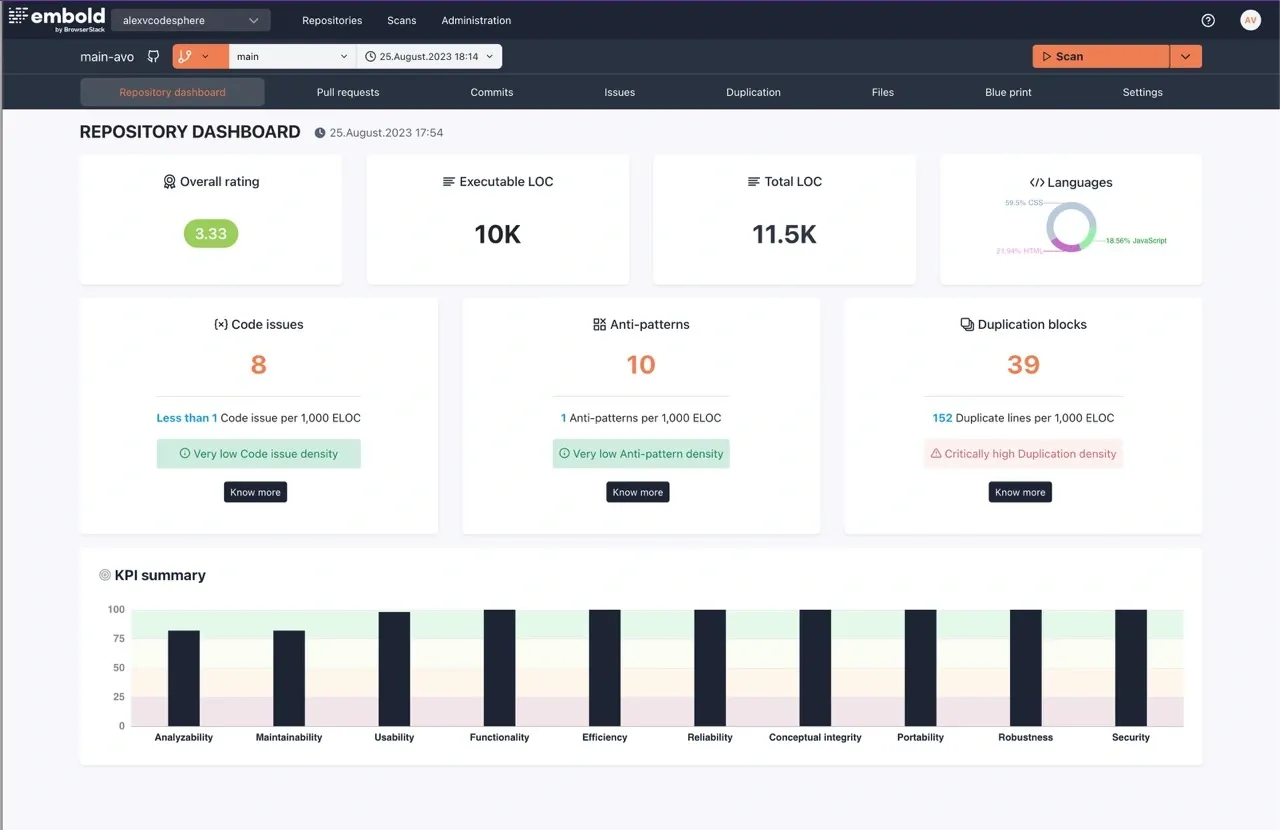
Embold's user interface is pretty self explanatory, after you selected one of your repos and Embold is finished analyzing, you will find a comprehensive overview of your codebase.

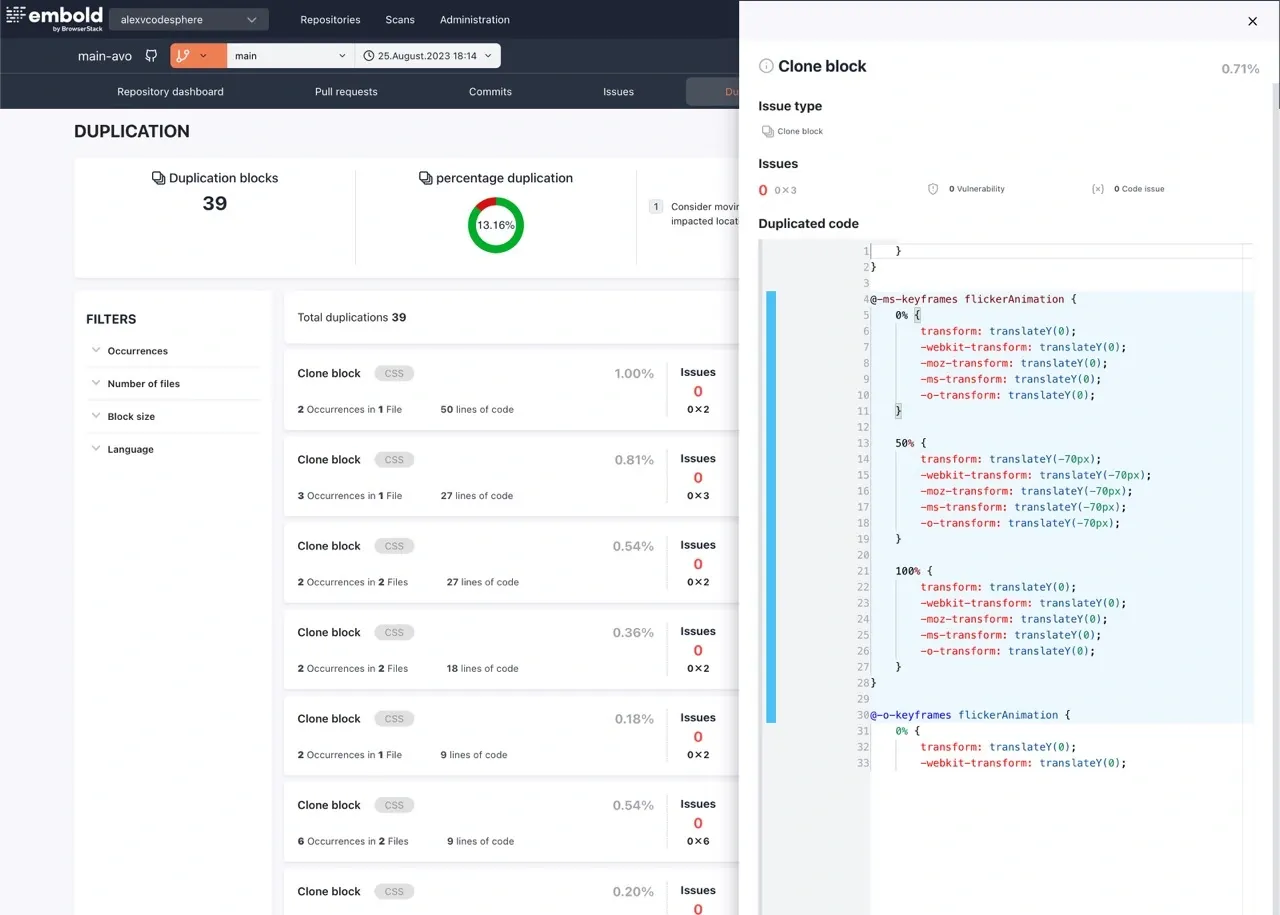
You will find deeper analysis over the results of your repo scan from the navigation menu which will give you information on Pull Requests, Commits, Found Issues, Duplication, Files as well as a blueprint of your repo in the form of a heat map or module dependency.
This way, you will be able to go into great detail on your code, even looking at individual files.

Conclusion
Embold makes it easy to scan your code for issues and receive in depth analysis. While we tried it on a small scale, this can especially come in handy for teams with codebases inceasing in complexity.
We recommend you to just connect your repo to see, if Embold might have found some issues you would otherwise have overlooked.
